Hockerton Housing Project is an exemplar of community energy:
- Collective purchasing and billing means we share information on our use, which encourages us to use energy efficiently
- The five homes on the Project share two wind turbines (total 11kW) and 7 solar PV arrays (total 13.6kW), and share the benefits of lower cost energy and income from exported energy
- HHP project managed the financing and installation of a community-owned 225kW Vestas V29 wind turbine which offsets the electricity use of the 54 households in Hockerton parish.
We now use the lessons from our experience in community energy to advise other individuals and communities (such as Gamlingay) on their renewable energy projects through our community energy masterclasses and ongoing consultancy support.
The short film below features Simon Tilley, a resident Director of Hockerton Housing Project, talking about the approach used by Sustainable Hockerton for its community-owned wind turbine.

More on this can be found in our wind turbine page. Live streaming can be seen here.
Want to learn more? Let us know if you would be interested in attending our next renewable energy masterclass for a practical view on the key issues for communities and landowners such as project management, finance and potential pitfalls from people who’ve been there, done that.
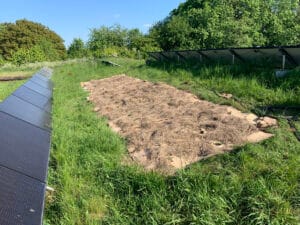
Agrivoltaics
We are currently exploring the potential for growing food between arrays of PVs with a view to developing a small scale project in a field near Hockerton.